PER is perhaps the most mainstream NBA advanced stat. But what is it? How is it calculated? Who created it? Here’s everything you need to know about the catch-all metric.

Analytics have significantly impacted the modern NBA. Advanced stats have changed how front offices evaluate players, how coaches create game plans and how players approach the game. While there are debates about whether the analytics movement has been good for basketball, there’s no denying the impact and prevalence of these metrics.
Player Efficiency Rating (PER) is perhaps the most popular and mainstream NBA advanced stat of them all. But what is PER? How is it calculated? And who created it?
Here’s everything you need to know about this catch-all metric.
How Is PER Calculated?
In the late ‘90s, a sportswriter named John Hollinger created PER in order to measure each NBA player’s overall impact on the game.
The idea was to boil down a player’s contributions to a single metric, which would make it easier to evaluate players and understand their on-court contributions.
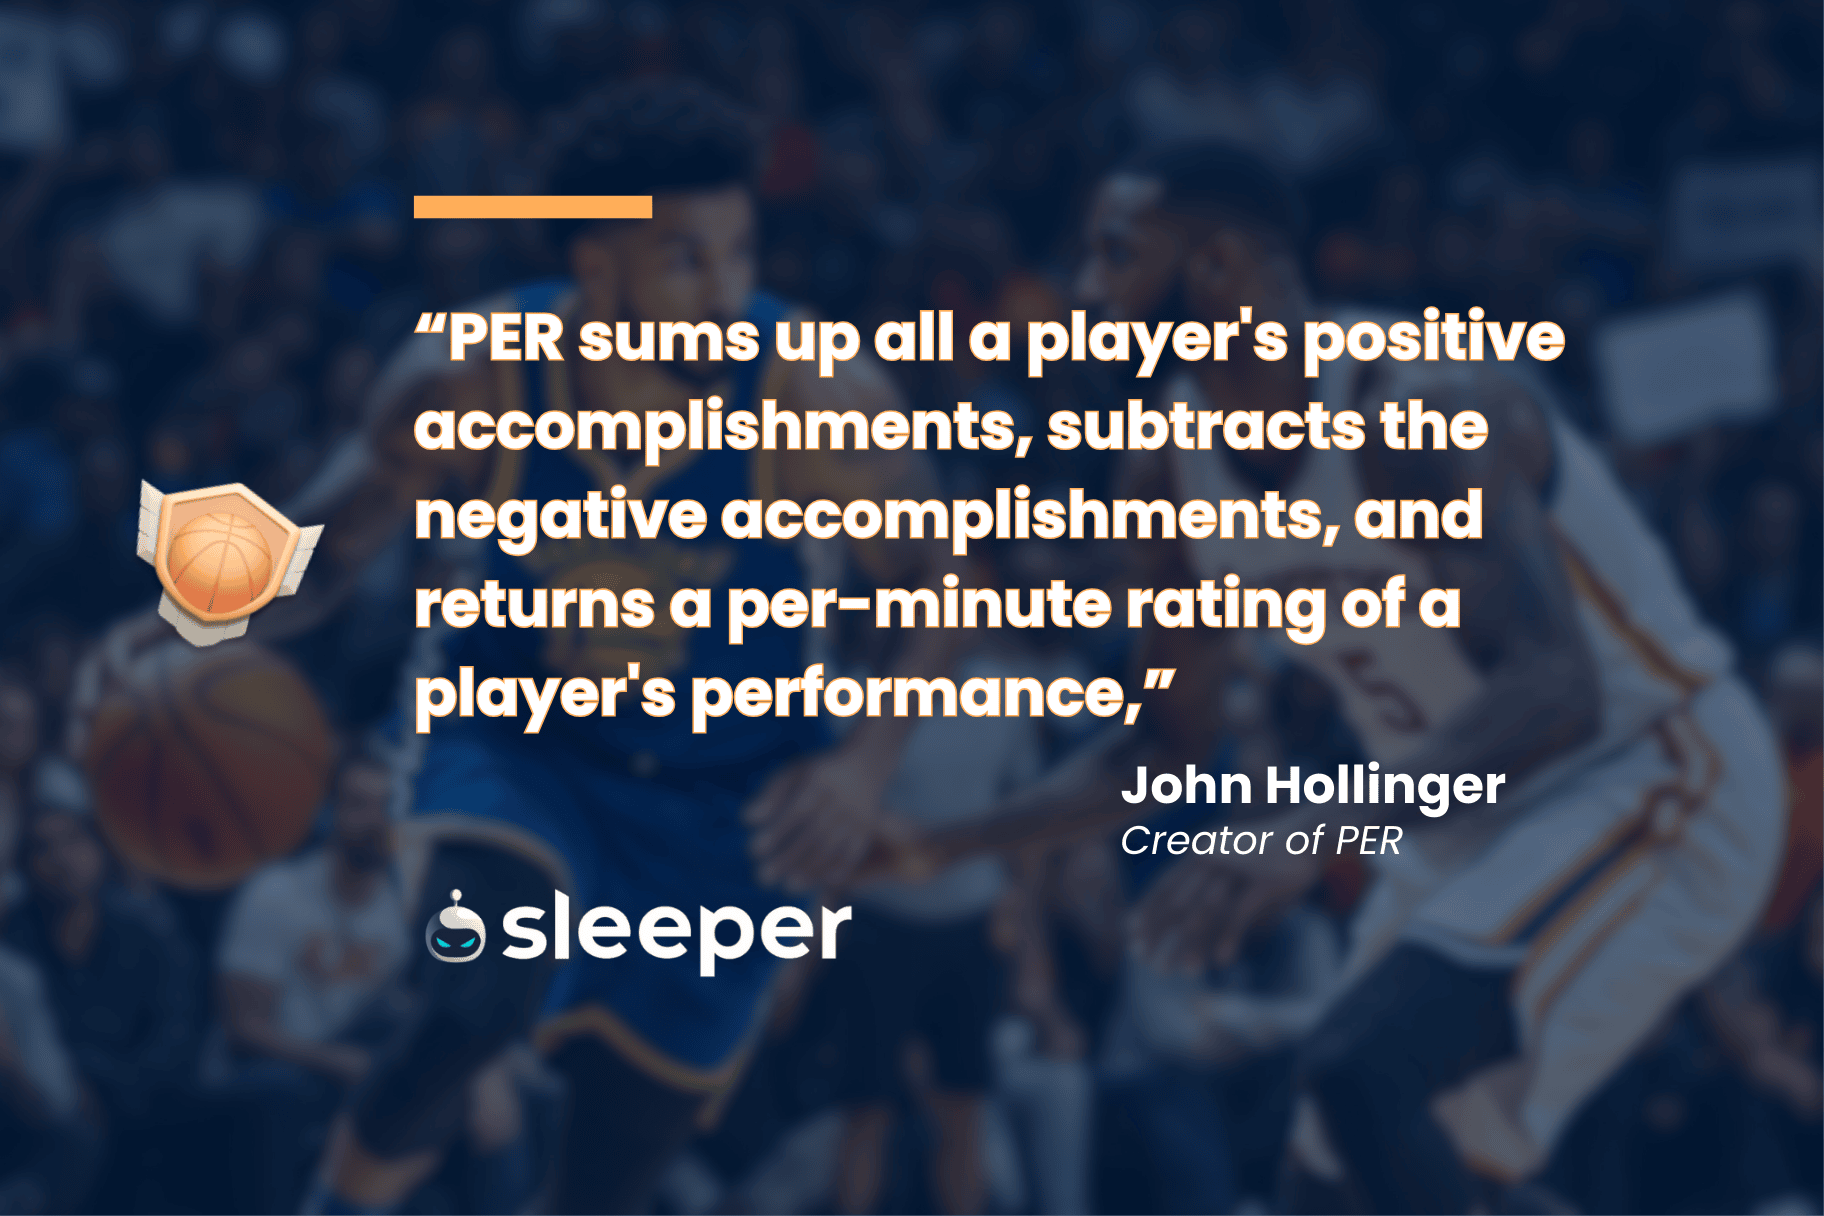
“PER sums up all a player's positive accomplishments, subtracts the negative accomplishments, and returns a per-minute rating of a player's performance,” Hollinger once said. He has also described it as "a rating of a player's per-minute productivity."
As Hollinger mentioned, PER factors in a player's positive contributions (including field goals, free throws, three-pointers, assists, rebounds, blocks and steals) and negative contributions (including missed field goals, missed free throws, turnovers, and personal fouls).
And since PER is pace-adjusted, it’s also useful for comparing players — even if they are from different teams or eras.
The formula for PER is quite complicated. Hollinger’s book Pro Basketball Forecast features an incredibly in-depth explanation of the PER formula, how it was created and why he settled on it. Here’s a look at the precise PER formula (courtesy of Basketball Reference), which may or may not require some Will Hunting-level smarts to decipher:
uPER = (1 / MP) *
[ 3P
+ (2/3) * AST
+ (2 - factor * (team_AST / team_FG)) * FG
+ (FT *0.5 * (1 + (1 - (team_AST / team_FG)) + (2/3) * (team_AST / team_FG)))
- VOP * TOV
- VOP * DRB% * (FGA - FG)
- VOP * 0.44 * (0.44 + (0.56 * DRB%)) * (FTA - FT)
+ VOP * (1 - DRB%) * (TRB - ORB)
+ VOP * DRB% * ORB
+ VOP * STL
+ VOP * DRB% * BLK
- PF * ((lg_FT / lg_PF) - 0.44 * (lg_FTA / lg_PF) * VOP) ]
If you’re wondering what factor, VOP, and DRB% mean, here’s a deeper look into the formula:
factor = (2 / 3) - (0.5 * (lg_AST / lg_FG)) / (2 * (lg_FG / lg_FT))
VOP = lg_PTS / (lg_FGA - lg_ORB + lg_TOV + 0.44 * lg_FTA)
DRB% = (lg_TRB - lg_ORB) / lg_TRB

What Is A Good PER in Basketball?
The league average in PER is 15, so anything above that is considered good and anything below that is considered below average. A PER above 20 is considered great, and anything above 25 is considered elite.
In recent seasons, the NBA’s league leaders each year have posted a PER around 30. For reference, the PER leader in 2023-24 was Denver Nuggets star Nikola Jokic (31.0).
As for a player’s career PER, anything above 20 is considered elite. Jokic’s 28.08 career PER is the highest in NBA history, followed by Michael Jordan (27.91) and LeBron James (27.06).
Using PER in Fantasy Basketball
How can understanding PER help you in fantasy basketball? Well, since it’s a metric that measures a player’s statistical output, it’s an easy way to find which players are consistently filling the stat sheet. It’s probably better for evaluating players in fantasy basketball than it is for judging players in real life, since fantasy basketball only cares about an individual’s stats.
To understand how PER can help predict fantasy success, let’s take a look at the PER leaders for the 2023-24 NBA season and see how they compare to the fantasy-points-per-game leaders.
PER Leaders in 2023-24
1. Nikola Jokic (31.0 PER)
2. Giannis Antetokounmpo (29.9 PER)
3. Shai Gilgeous-Alexander (29.3 PER)
4. Luka Doncic (28.1 PER)
5. Anthony Davis (25.8 PER)
6. LeBron James (23.7 PER)
7. Jalen Brunson (23.4 PER)
8. Tyrese Haliburton (23.3 PER)
9. Kristaps Porzingis (23.2 PER)
10T. Domantas Sabonis (23.2 PER)
10T. Kawhi Leonard (23.2 PER)
FPPG Leaders in 2023-24
1. Luka Doncic (59.34 FPPG)
2. Joel Embiid (59.30 FPPG)
3. Nikola Jokic (57.18 FPPG)
4. Giannis Antetokounmpo (55.75 FPPG)
5. Anthony Davis (52.42 FPPG)
6. Shai Gilgeous-Alexander (51.40 FPPG)
7. Victor Wembanyama (48.97 FPPG)
8. Domantas Sabonis (47.69 FPPG)
9. LeBron James (45.02 FPPG)
10. Jayson Tatum (45.02 FPPG)
It’s notable that seven of the top-10 players are the same across both lists. And it would be eight if Embiid’s 34.38 PER qualified for the leaderboard, but he only played in 39 games.
As you’re drafting a fantasy basketball team, perhaps PER can be a useful tool for evaluating players.

Frequently Asked Questions
What is the highest PER in NBA history?
For 60 years, the single-season PER record belonged to Wilt Chamberlain, who posted a 32.08 PER during the 1961-62 season. However, his record was broken during the 2021-22 season by Jokic. That year, Jokic posted a 32.85 PER and won his second-consecutive NBA MVP award.
Embiid was on pace to top Jokic’s mark during the 2023-24 NBA season, posting a 34.38 PER prior to suffering a meniscus injury that cut his season significantly short.
Jokic currently holds the single-season and career PER records.
What are some of the downsides of PER?
Hollinger is the first to admit that PER isn’t (sigh) PERfect.
Hollinger has stated: “Bear in mind that PER is not the final, once-and-for-all evaluation of a player's accomplishments during the season. This is especially true for defensive specialists who don't get many blocks or steals.”
A terrific defender who constantly makes plays that don’t show up in the box score will be underrated by PER, because it measures players based on their stats.
Also, PER may overrate certain players who stuff the stat sheet but hurt their team — like ball hogs who put up points but hurt team chemistry and ball movement in the process. Some people argue that trying to sum up a player's productivity with a single number is reductive and overlooks the nuances of their game.
Who is John Hollinger?
Hollinger is known as one of the forefathers of advanced NBA stats. Not only did he create PER and other metrics, he has also been injecting analytics into his articles and analysis since the late ‘90s. Since Hollinger has written for some of the largest outlets (including ESPN and The Athletic), he helped introduce advanced stats to many fans and make them mainstream.
Hollinger joined the Memphis Grizzlies front office in 2012 as the team's Vice President of Basketball Operations, and he remained with the organization through 2019. It's rare that a sportswriter goes on to become a decision-maker for an NBA franchise, but Hollinger’s unique skill set made him a good fit. He has since returned to sports journalism, writing for The Athletic.
Are there any other catch-all metrics that measure a player’s overall impact?
While PER was the first metric to boil down a player’s contributions to a single number, others have popped up in the years since. Let’s break them down.
Win Shares
This metric estimates the number of wins a player contributed based on their productivity. Last year, Jokic (17.0), Gilgeous-Alexander (14.6) and Antetokounmpo (13.2) led all players in win shares.
Box Plus/Minus
This is a box score estimate of the points per 100 possessions that a player contributed above a league-average player translated to an average team. Last year, the leaders in box plus-minus were Jokic (13.2), Doncic (9.9), Antetokounmpo (9.0), and Gilgeous-Alexander (9.0).
VORP (Value Over Replacement Player)
This is a box score estimate of the points per 100 team possessions that a player contributed above a replacement-level player translated to an average team and pro-rated to an 82-game season. Last season, the VORP leaders were Jokic (10.6), Doncic (8.0), Antetokounmpo (7.2), and Gilgeous-Alexander (7.1).
It’s worth noting that PER, Win Shares, Box Plus/Minus, and VORP all tend to value players pretty similarly – at least when it comes to the top players – as the league-leaders in all of these metrics are virtually the same.
Play Fantasy Basketball on SleePER
That’s everything you need to know about Player Efficiency Rating! (And did you see what we did up there?) If you’re interested in taking this knowledge and applying it to fantasy basketball, Sleeper has you covered.
If you’d like to start a fantasy basketball league, there’s no better platform than Sleeper thanks to exclusive features like Lock-In mode, Game-Pick mode, voice and text chat, custom scoring, in-depth notes for research, custom playoff settings, no ads, multi-team trades, every type of league (including keeper and dynasty), weekly league reports, live scoring, each player's transaction history and more.
If you prefer daily fantasy sports (DFS), give Sleeper Picks a try. You can maximize your winnings by 100x with just a few selections regarding whether players surpass or fall short of their projected stats. You can also follow live gamecasts as you compete.


